In this article, we will explore the critical metrics essential for monitoring Apache Kafka effectively. Understanding and tracking these key metrics are crucial for ensuring the performance, reliability, and scalability of your Kafka clusters in real-time data processing environments.
Table of Contents
What is Apache Kafka?

Apache Kafka is a distributed streaming platform used for building real-time data pipelines and streaming applications. It’s like a highly efficient and scalable messaging system that can handle large volumes of data in real-time.
Apache Kafka Architecture

Let’s break down the components and their interaction using Zomato, a food delivery app, as an example:
Producers:
- In Kafka, producers are processes or applications that publish streams of data (records) to Kafka topics.
- In Zomato’s case, various services could act as producers:
- An order placement service might publish a stream of records whenever a new order is created. This record could include details like customer ID, restaurant ID, and order items.
- A real-time location service might publish updates on the location of delivery personnel.
Brokers:
- Kafka brokers are servers that store the published streams of records. They act as the central nervous system of the Kafka architecture.
- Zomato would likely run a cluster of Kafka brokers to handle the high volume of data generated by its various services.
Topics:
- Topics are categories or feeds in Kafka where related records are grouped. A topic can have multiple partitions (shards) for scalability.
- Zomato could have topics for different purposes:
- A topic named “order_events” might hold all the order placement records.
- Another topic named “delivery_updates” might hold location updates for delivery personnel.
Consumers:
- Consumers are processes or applications that subscribe to topics of interest and consume the published streams of records.
- In Zomato’s scenario, various consumer applications might be subscribed to relevant topics:
- A service managing order deliveries might subscribe to the “order_events” topic to receive notifications about new orders and assign them to delivery personnel.
- A real-time tracking dashboard might subscribe to the “delivery_updates” topic to display the live location of delivery personnel.
Zookeeper:
- While not explicitly shown in the image, Kafka often uses Zookeeper, a distributed coordination service, for tasks like leader election (choosing a replica broker to handle reads/writes for a partition) and maintaining cluster configuration.
- In Zomato’s case, Zookeeper would ensure coordination among the Kafka brokers in the cluster.
Important Metrics to Monitor in Kafka
A few metrics are super important to have:
- Number of active controllers: should always be 1
Metric-kafka_controller_kafkacontroller_activecontrollercount

- Number of underreplicated partitions: should always be 0
Metric-kafka_cluster_partition_underreplicated

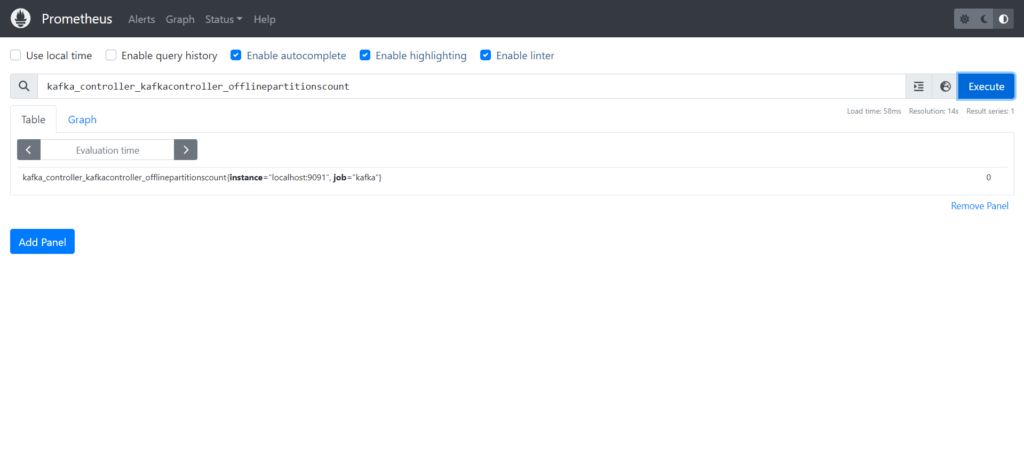
- Number of offline partitions: should always be 0
Metric-kafka_controller_kafkacontroller_offlinepartitionscount
Apache Kafka Metrics
Kafka metrics can be broken down into three categories:
- Kafka server (broker) metrics
- Kafka Producer metrics
- Kafka Consumer metrics
- Zookeeper metrics
- JVM Metrics
1.Broker Metrics
Monitoring and alerting on issues as they emerge in your broker cluster is critical since all messages must pass through a Kafka broker to be consumed.
Key Broker Metrics:
- Topic Activity: Track the volume of messages being produced and consumed across different topics. This helps identify popular topics, potential bottlenecks, and overall cluster load.
- Broker Performance: Monitor key broker metrics like CPU, memory usage, and network I/O. This allows you to identify overloaded brokers and potential resource constraints.
- Replication: Ensure data integrity and redundancy by monitoring replication metrics. These metrics track the flow of data copies between replicas and identify any replication lags or failures.
- Consumer Groups: Gain insights into consumer group behavior. Monitor metrics like consumer offsets and lag to ensure consumers are actively processing messages and identify any lagging consumers.
- Errors: Quickly identify and troubleshoot issues by monitoring error metrics. These metrics track errors like produce request failures, fetch request failures, and invalid message formats.
| Name | Description |
| UnderReplicatedPartitions | The number of under-replicated partitions across all topics on the broker. Under-replicated partition metrics are a leading indicator of one or more brokers being unavailable. |
| IsrShrinksPerSec/IsrExpandsPerSec | If a broker goes down, in-sync replica ISRs for some of the partitions shrink. When that broker is up again, ISRs are expanded once the replicas are fully caught up. |
| ActiveControllerCount | Indicates whether the broker is active and should always be equal to 1 since there is only one broker at the same time that acts as a controller. |
| OfflinePartitionsCount | The number of partitions that don’t have an active leader and are hence not writable or readable. A non-zero value indicates that brokers are not available. |
| LeaderElectionRateAndTimeMs | A partition leader election happens when ZooKeeper is not able to connect with the leader. This metric may indicate a broker is unavailable. |
| UncleanLeaderElectionsPerSec | A leader may be chosen from out-of-sync replicas if the broker which is the leader of the partition is unavailable and a new leader needs to be elected. This metric can indicate potential message loss. |
| TotalTimeMs | The time is taken to process the message. |
| PurgatorySize | The size of purgatory requests. Can help identify the main causes of the delay. |
| BytesInPerSec/BytesOutPerSec | The number of data brokers received from producers and the number that consumers read from brokers. This is an indicator of the overall throughput or workload in the Kafka cluster. |
| RequestsPerSecond | Frequency of requests from producers, consumers, and subscribers. |
2.Producer Metrics
Producer metrics provide valuable insights into the behavior and performance of applications sending messages to your Kafka cluster.
Key Producer Metrics:
- Message Production Rate: The number of messages produced per second by the producer application. This helps gauge the overall message volume being sent to Kafka.
- Batch Size: The average size of message batches sent by the producer. Larger batches can improve throughput, but finding the optimal size depends on factors like topic replication and network latency.
- Delivery Rate: The rate at which messages are successfully delivered to Kafka brokers. This metric helps identify any bottlenecks or delays in the message production pipeline.
- Latency: The time it takes for a message to be sent from the producer to the Kafka broker. Analyzing latency can reveal potential issues like network congestion or overloaded brokers.
- Producer Errors: Track errors encountered by the producer, such as produce request failures or serialization errors. Identifying these errors can help diagnose and fix issues with the producer application.
| Name | Description |
| compression-rate-avg | Average compression rate of sent batches. |
| response-rate | An average number of responses received per producer. |
| request-rate | An average number of responses sent per producer. |
| request-latency-avg | Average request latency in milliseconds. |
| outgoing-byte-rate | An average number of outgoing bytes per second. |
| io-wait-time-ns-avg | The average length of time the I/O thread spent waiting for a socket (in ns). |
| batch-size-avg | The average number of bytes sent per partition per request. |
3.Consumer Metrics
Consumer metrics are crucial for understanding how efficiently your applications are processing messages from Kafka topics.
Consumer metrics offer a window into various aspects of your Kafka consumers, including:
- Consumption Rate: Track the number of messages a consumer is processing per second. This helps gauge overall processing efficiency and identify consumers that might be falling behind.
- Fetch Behavior: Monitor metrics like fetch size and frequency to understand how consumers are requesting data from brokers. This can reveal potential inefficiencies in data fetching strategies.
- Offsets: Track consumer offsets to determine their progress within a topic partition. Offsets indicate the last message a consumer has successfully processed. Lagging offsets could signal slow processing or consumer failures.
- Commit Intervals: Monitor how often consumers commit their offsets to Kafka. Frequent commits ensure timely processing updates but can introduce additional overhead. Conversely, infrequent commits might lead to data loss during consumer failures.
- Errors: Identify and diagnose issues related to message consumption. Consumer error metrics might reveal problems like invalid messages, network errors, or timeouts.
| Name | Description |
| records-lag | The number of messages consumer is behind the producer on this partition. |
| records-lag-max | Maximum record lag. Increasing value means that the consumer is not keeping up with the producers. |
| bytes-consumed-rate | Average bytes consumed per second for each consumer for a specific topic or across all topics. |
| records-consumed-rate | An average number of records consumed per second for a specific topic or across all topics. |
| fetch-rate | The number of fetch requests per second from the consumer. |
4.Zookeeper metrics
ZooKeeper, the crucial distributed coordination service for many Kafka deployments, also offers a rich set of metrics to monitor its health and performance.
Categories of ZooKeeper metrics:
- Cluster State: Monitor metrics like the number of active servers, followers, and observers in your ZooKeeper ensemble. This ensures quorum health and identifies potential issues like server outages or connectivity problems.
- Request Processing: Track metrics like the number of requests per second (reads, writes), request latencies, and failed requests. This helps identify overloaded servers or potential bottlenecks within ZooKeeper.
- Watcher Performance: Watchers are a core ZooKeeper feature for notifications on data changes. Monitor metrics like the number of watchers and average watch event latency to ensure efficient change notification mechanisms.
- Synchronization: ZooKeeper uses synchronization primitives like locks. Track metrics like lock acquisition times and contention rates to identify potential synchronization bottlenecks in your applications.
| Name | Description |
| outstanding-requests | The number of requests that are in the queue. |
| avg-latency | The response time to a client request is in milliseconds. |
| num-alive-connections | The number of clients connected to ZooKeeper. |
| followers | The number of active followers. |
| pending-syncs | The number of pending consumers syncs. |
| open-file-descriptor-count | The number of used file descriptors. |
5.JVM Metrics
While Kafka itself provides valuable metrics, the underlying JVM (Java Virtual Machine) offers another crucial layer of monitoring for your Kafka deployment. JVM metrics expose insights into the health and performance of the Java environment running your Kafka.
- Memory Usage: Track metrics like heap memory usage, non-heap memory usage, and garbage collection activity. This helps ensure sufficient memory allocation and identify potential memory leaks or excessive garbage collection overhead impacting Kafka’s performance.
- Threading: Monitor metrics like thread count, CPU usage by threads, and thread pool utilization. This helps identify potential thread starvation or overloaded thread pools, ensuring efficient resource allocation for Kafka tasks.
- Class Loading: Track metrics like the number of loaded classes and class loading times. This helps identify issues with classpath configuration or excessive class loading impacting application startup times.
- File Descriptors: Monitor the number of open file descriptors to identify potential resource exhaustion and ensure proper file descriptor management within the Kafka brokers.
JVM garbage collector metrics
| Name | Description |
| CollectionCount | The total number of young or old garbage collection processes performed by the JVM. |
| CollectionTime | The total amount of time in milliseconds that the JVM spent executing young or old garbage collection processes. |
Host metrics
| Name | Description |
| Page cache reads ratio | The ratio of the number of reads from the cache pages and the number of reads from the disk. |
| Disk usage | The amount of used and available disk space. |
| CPU usage | The CPU is rarely the source of performance issues. However, if you see spikes in CPU usage, this metric should be investigated. |
| Network bytes sent/received | The amount of incoming and outgoing network traffic. |
Prometheus provides Kafka metrics file using jmx_exporter in below official prometheus jmx_exporter official GitHub repository. For this setup, we’ll use the kafka-2_0_0.yml sample configuration.
lowercaseOutputName: true

rules:
# Special cases and very specific rules
- pattern : kafka.server<type=(.+), name=(.+), clientId=(.+), topic=(.+), partition=(.*)><>Value
  name: kafka_server_$1_$2
  type: GAUGE
  labels:
    clientId: "$3"
    topic: "$4"
    partition: "$5"
- pattern : kafka.server<type=(.+), name=(.+), clientId=(.+), brokerHost=(.+), brokerPort=(.+)><>Value
  name: kafka_server_$1_$2
  type: GAUGE
  labels:
    clientId: "$3"
    broker: "$4:$5"
- pattern : kafka.coordinator.(\w+)<type=(.+), name=(.+)><>Value
  name: kafka_coordinator_$1_$2_$3
  type: GAUGE

# Generic per-second counters with 0-2 key/value pairs
- pattern: kafka.(\w+)<type=(.+), name=(.+)PerSec\w*, (.+)=(.+), (.+)=(.+)><>Count
  name: kafka_$1_$2_$3_total
  type: COUNTER
  labels:
    "$4": "$5"
    "$6": "$7"
- pattern: kafka.(\w+)<type=(.+), name=(.+)PerSec\w*, (.+)=(.+)><>Count
  name: kafka_$1_$2_$3_total
  type: COUNTER
  labels:
    "$4": "$5"
- pattern: kafka.(\w+)<type=(.+), name=(.+)PerSec\w*><>Count
  name: kafka_$1_$2_$3_total
  type: COUNTER

# Quota specific rules
- pattern: kafka.server<type=(.+), user=(.+), client-id=(.+)><>([a-z-]+)
  name: kafka_server_quota_$4
  type: GAUGE
  labels:
    resource: "$1"
    user: "$2"
    clientId: "$3"
- pattern: kafka.server<type=(.+), client-id=(.+)><>([a-z-]+)
  name: kafka_server_quota_$3
  type: GAUGE
  labels:
    resource: "$1"
    clientId: "$2"
- pattern: kafka.server<type=(.+), user=(.+)><>([a-z-]+)
  name: kafka_server_quota_$3
  type: GAUGE
  labels:
    resource: "$1"
    user: "$2"

# Generic gauges with 0-2 key/value pairs
- pattern: kafka.(\w+)<type=(.+), name=(.+), (.+)=(.+), (.+)=(.+)><>Value
  name: kafka_$1_$2_$3
  type: GAUGE
  labels:
    "$4": "$5"
    "$6": "$7"
- pattern: kafka.(\w+)<type=(.+), name=(.+), (.+)=(.+)><>Value
  name: kafka_$1_$2_$3
  type: GAUGE
  labels:
    "$4": "$5"
- pattern: kafka.(\w+)<type=(.+), name=(.+)><>Value
  name: kafka_$1_$2_$3
  type: GAUGE

# Emulate Prometheus 'Summary' metrics for the exported 'Histogram's.
#
# Note that these are missing the '_sum' metric!
- pattern: kafka.(\w+)<type=(.+), name=(.+), (.+)=(.+), (.+)=(.+)><>Count
  name: kafka_$1_$2_$3_count
  type: COUNTER
  labels:
    "$4": "$5"
    "$6": "$7"
- pattern: kafka.(\w+)<type=(.+), name=(.+), (.+)=(.*), (.+)=(.+)><>(\d+)thPercentile
  name: kafka_$1_$2_$3
  type: GAUGE
  labels:
    "$4": "$5"
    "$6": "$7"
    quantile: "0.$8"
- pattern: kafka.(\w+)<type=(.+), name=(.+), (.+)=(.+)><>Count
  name: kafka_$1_$2_$3_count
  type: COUNTER
  labels:
    "$4": "$5"
- pattern: kafka.(\w+)<type=(.+), name=(.+), (.+)=(.*)><>(\d+)thPercentile
  name: kafka_$1_$2_$3
  type: GAUGE
  labels:
    "$4": "$5"
    quantile: "0.$6"
- pattern: kafka.(\w+)<type=(.+), name=(.+)><>Count
  name: kafka_$1_$2_$3_count
  type: COUNTER
- pattern: kafka.(\w+)<type=(.+), name=(.+)><>(\d+)thPercentile
  name: kafka_$1_$2_$3
  type: GAUGE
  labels:
    quantile: "0.$4"

# Generic gauges for MeanRate Percent
# Ex) kafka.server<type=KafkaRequestHandlerPool, name=RequestHandlerAvgIdlePercent><>MeanRate
- pattern: kafka.(\w+)<type=(.+), name=(.+)Percent\w*><>MeanRate
  name: kafka_$1_$2_$3_percent
  type: GAUGE
- pattern: kafka.(\w+)<type=(.+), name=(.+)Percent\w*><>Value
  name: kafka_$1_$2_$3_percent
  type: GAUGE
- pattern: kafka.(\w+)<type=(.+), name=(.+)Percent\w*, (.+)=(.+)><>Value
  name: kafka_$1_$2_$3_percent
  type: GAUGE
  labels:
    "$4": "$5"
Conclusion:
In conclusion, monitoring Apache Kafka involves tracking essential metrics across brokers, producers, consumers, and ZooKeeper, ensuring optimal performance and reliability in real-time data processing environments. By focusing on these key metrics, organizations can proactively manage Kafka clusters and maintain high availability for their streaming applications.
Reference:-
For reference visit the official website .
Any queries pls contact us @Fosstechnix.com.
Related Articles:
Hi Akash
Do you have any thread where i can understand how we can setup these metrics in prometheus. Like the configuration steps
Thanks
Prakhar