In this article, we’ll explore how to monitor Apache Kafka using Prometheus and Grafana with JMX Exporter, providing insights into Kafka’s performance and health metrics.

Table of Contents
What is Apache Kafka?

Apache Kafka is a distributed streaming platform used for building real-time data pipelines and streaming applications. It’s like a highly efficient and scalable messaging system that can handle large volumes of data in real-time.
What is Prometheus?

Prometheus is an open-source monitoring and alerting toolkit designed for reliability and scalability in modern, dynamic environments. Developed by the Cloud Native Computing Foundation, Prometheus excels at collecting and storing time-series data, allowing users to gain valuable insights into the performance and health of their applications and infrastructure.
With its powerful query language and support for multi-dimensional data, Prometheus has become a popular choice for monitoring systems within cloud-native ecosystems.
What is Grafana?
Grafana is an open source tool for performing data analytics, retrieving metrics that make sense of large amounts of data, and monitoring our apps using nice configurable dashboards.
Grafana integrates with a wide range of data sources, including Graphite, Prometheus, Influx DB, ElasticSearch, MySQL, PostgreSQL, and others. When connected to supported data sources, it provides web-based charts, graphs, and alerts.
What is JMX Exporter?
The JMX Exporter is a Java agent that exposes Java Management Extensions (JMX) metrics as Prometheus metrics. It allows monitoring of Java applications by converting JMX data into a format that can be scraped by Prometheus, enabling visualization and alerting through Grafana dashboards.
Prerequisites
- Create Ubuntu Instance 24.04 LTS and Instance type should be (T2.medium)
- SSH Access with Sudo privileges
- Apache Kafka, Prometheus, Grafana should be Installed
- Firewall Port 9091,9090,3000,2181
- JDK 1.8 or higher version
Steps for Monitoring Apache Kafka Using Prometheus and Grafana
Step#1:Setup JMX Exporter on Kafka Server
Download the JMX Exporter JAR file (jmx_prometheus_javaagent-0.20.0.jar) from the official repository or your preferred source.
wget https://repo.maven.apache.org/maven2/io/prometheus/jmx/jmx_prometheus_javaagent/0.20.0/jmx_prometheus_javaagent-0.20.0.jar
Move the JAR file to the Kafka libs directory:
sudo mv jmx_prometheus_javaagent-0.20.0.jar /opt/kafka/libs/
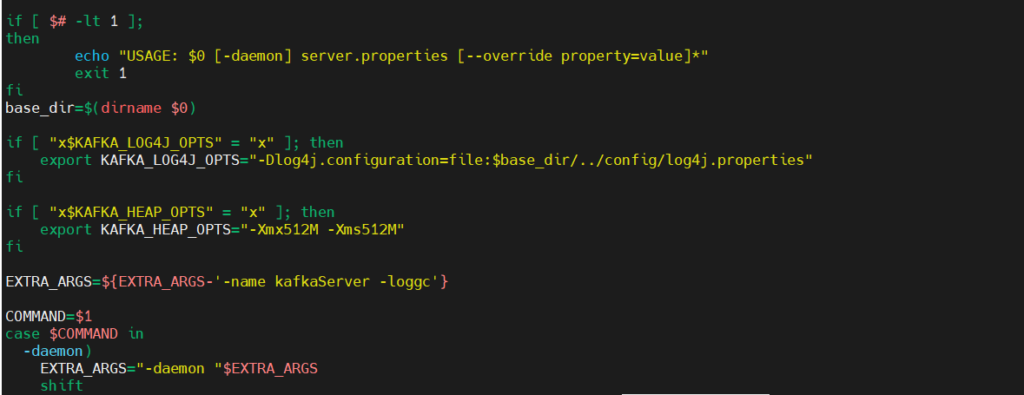
Configure Kafka to use the JMX Exporter by adding the following options to the Kafka startup script (kafka-server-start.sh):
sudo nano /opt/kafka/bin/kafka-server-start.sh
Add the below lines at the end
KAFKA_OPTS="-javaagent:/opt/kafka/libs/jmx_prometheus_javaagent-0.20.0.jar=9091:/etc/prometheus/prometheus.yml"
KAFKA_OPTS="-javaagent:/opt/kafka/libs/jmx_prometheus_javaagent-0.20.0.jar=9091:/opt/kafka/config/sample_jmx_exporter.yml"

and also add the below line in the if block to avoid storage error
export KAFKA_HEAP_OPTS="-Xmx512M -Xms512M"
Restart Kafka for the changes to take effect:
sudo systemctl daemon-reload
sudo systemctl restart kafka
Step#2:Configure the JMX Exporter for Kafka
Configuring the JMX Exporter for Apache Kafka involves specifying regex patterns to name and filter the metrics for Prometheus. Prometheus provides sample configurations for this purpose in their GitHub repository, making the setup process more straightforward.
cd /opt/kafka/config
sudo nano sample_jmx_exporter.yml
Duplicate its contents in a file inside config directory within Kafka’s home directory.
lowercaseOutputName: true

rules:
# Special cases and very specific rules
- pattern : kafka.server<type=(.+), name=(.+), clientId=(.+), topic=(.+), partition=(.*)><>Value
  name: kafka_server_$1_$2
  type: GAUGE
  labels:
    clientId: "$3"
    topic: "$4"
    partition: "$5"
- pattern : kafka.server<type=(.+), name=(.+), clientId=(.+), brokerHost=(.+), brokerPort=(.+)><>Value
  name: kafka_server_$1_$2
  type: GAUGE
  labels:
    clientId: "$3"
    broker: "$4:$5"
- pattern : kafka.coordinator.(\w+)<type=(.+), name=(.+)><>Value
  name: kafka_coordinator_$1_$2_$3
  type: GAUGE

# Generic per-second counters with 0-2 key/value pairs
- pattern: kafka.(\w+)<type=(.+), name=(.+)PerSec\w*, (.+)=(.+), (.+)=(.+)><>Count
  name: kafka_$1_$2_$3_total
  type: COUNTER
  labels:
    "$4": "$5"
    "$6": "$7"
- pattern: kafka.(\w+)<type=(.+), name=(.+)PerSec\w*, (.+)=(.+)><>Count
  name: kafka_$1_$2_$3_total
  type: COUNTER
  labels:
    "$4": "$5"
- pattern: kafka.(\w+)<type=(.+), name=(.+)PerSec\w*><>Count
  name: kafka_$1_$2_$3_total
  type: COUNTER

- pattern: kafka.server<type=(.+), client-id=(.+)><>([a-z-]+)
  name: kafka_server_quota_$3
  type: GAUGE
  labels:
    resource: "$1"
    clientId: "$2"

- pattern: kafka.server<type=(.+), user=(.+), client-id=(.+)><>([a-z-]+)
  name: kafka_server_quota_$4
  type: GAUGE
  labels:
    resource: "$1"
    user: "$2"
    clientId: "$3"

# Generic gauges with 0-2 key/value pairs
- pattern: kafka.(\w+)<type=(.+), name=(.+), (.+)=(.+), (.+)=(.+)><>Value
  name: kafka_$1_$2_$3
  type: GAUGE
  labels:
    "$4": "$5"
    "$6": "$7"
- pattern: kafka.(\w+)<type=(.+), name=(.+), (.+)=(.+)><>Value
  name: kafka_$1_$2_$3
  type: GAUGE
  labels:
    "$4": "$5"
- pattern: kafka.(\w+)<type=(.+), name=(.+)><>Value
  name: kafka_$1_$2_$3
  type: GAUGE

# Emulate Prometheus 'Summary' metrics for the exported 'Histogram's.
#
# Note that these are missing the '_sum' metric!
- pattern: kafka.(\w+)<type=(.+), name=(.+), (.+)=(.+), (.+)=(.+)><>Count
  name: kafka_$1_$2_$3_count
  type: COUNTER
  labels:
    "$4": "$5"
    "$6": "$7"
- pattern: kafka.(\w+)<type=(.+), name=(.+), (.+)=(.*), (.+)=(.+)><>(\d+)thPercentile
  name: kafka_$1_$2_$3
  type: GAUGE
  labels:
    "$4": "$5"
    "$6": "$7"
    quantile: "0.$8"
- pattern: kafka.(\w+)<type=(.+), name=(.+), (.+)=(.+)><>Count
  name: kafka_$1_$2_$3_count
  type: COUNTER
  labels:
    "$4": "$5"
- pattern: kafka.(\w+)<type=(.+), name=(.+), (.+)=(.*)><>(\d+)thPercentile
  name: kafka_$1_$2_$3
  type: GAUGE
  labels:
    "$4": "$5"
    quantile: "0.$6"
- pattern: kafka.(\w+)<type=(.+), name=(.+)><>Count
  name: kafka_$1_$2_$3_count
  type: COUNTER
- pattern: kafka.(\w+)<type=(.+), name=(.+)><>(\d+)thPercentile
  name: kafka_$1_$2_$3
  type: GAUGE
  labels:
    quantile: "0.$4"
Save the file and on to the next step.
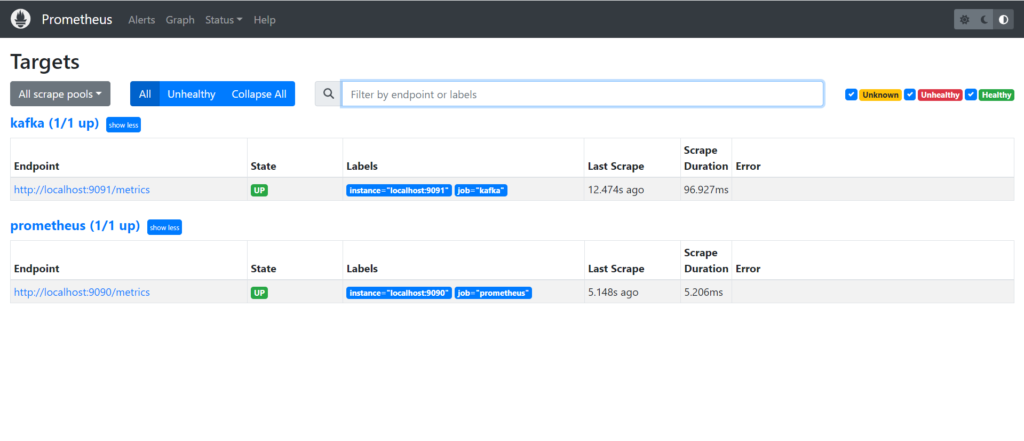
Step#3:Add Kafka Endpoint in Prometheus
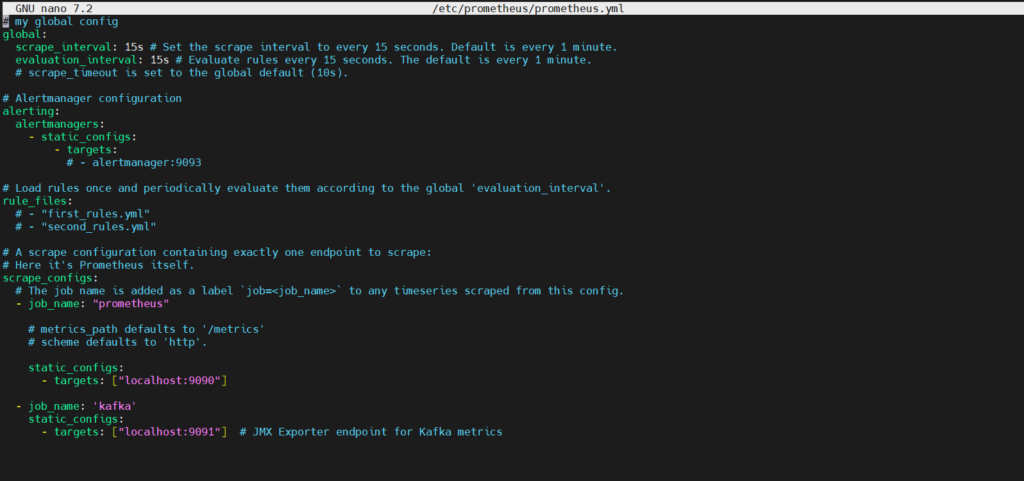
Append below at the end of “/etc/prometheus/prometheus.yml” to register kafka server as targets for Prometheus to collect metrics from. This file should be existing after above installation steps.
sudo nano /etc/prometheus/prometheus.yml
scrape_configs:
  # The job name is added as a label `job=<job_name>` to any timeseries scraped from this config.
  - job_name: "prometheus"

    # metrics_path defaults to '/metrics'
    # scheme defaults to 'http'.

    static_configs:
      - targets: ["localhost:9090"]

  - job_name: 'kafka'
    static_configs:
      - targets: ["localhost:9091"]  # JMX Exporter endpoint for Kafka metrics
Restart Prometheus using below commands:
sudo systemctl daemon-reload
sudo systemctl restart prometheus
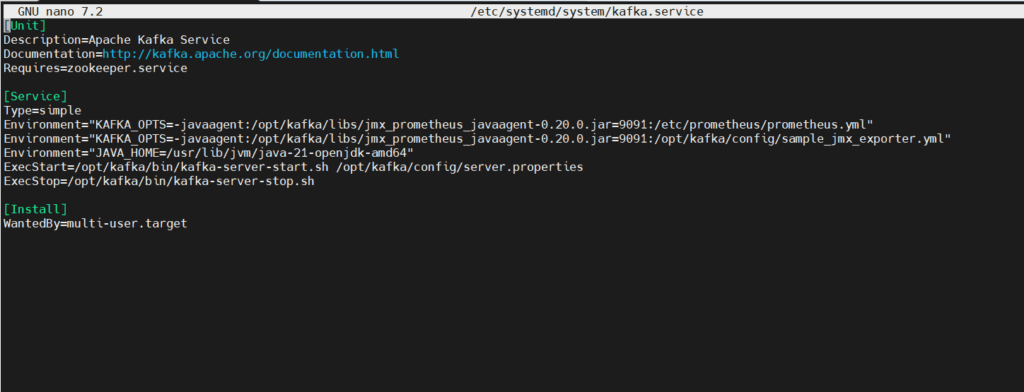
Step#4:Update Kafka Systemd Unit File
The updated part of the systemd service file for Apache Kafka includes environment variables for JAVA_HOME and KAFKA_OPTS, ensuring proper Java and Kafka configuration for smooth operation and monitoring integration with JMX Exporter, Prometheus, and Grafana.
sudo nano /etc/systemd/system/kafka.service
[Unit]
Description=Apache Kafka Service
Documentation=http://kafka.apache.org/documentation.html
Requires=zookeeper.service

[Service]
Type=simple
Environment="JAVA_HOME=/usr/lib/jvm/java-21-openjdk-amd64"
Environment="KAFKA_OPTS=-javaagent:/opt/kafka/libs/jmx_prometheus_javaagent-0.20.0.jar=9091:/etc/prometheus/prometheus.yml"
Environment="KAFKA_OPTS=-javaagent:/opt/kafka/libs/jmx_prometheus_javaagent-0.20.0.jar=9091:/opt/kafka/config/sample_jmx_exporter.yml"
ExecStart=/opt/kafka/bin/kafka-server-start.sh /opt/kafka/config/server.properties
ExecStop=/opt/kafka/bin/kafka-server-stop.sh
Restart=on-failure

[Install]
WantedBy=multi-user.target
Restart Kafka for the changes to take effect:
sudo systemctl daemon-reload
sudo systemctl restart kafka
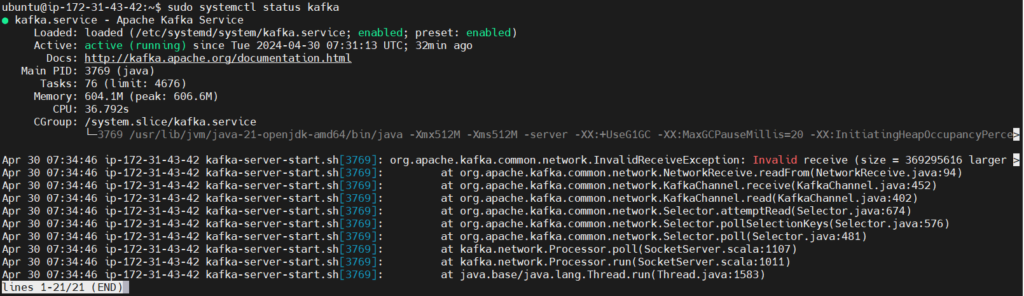
Step#5:Check the Status of Kafka and Prometheus Service
sudo systemctl status prometheus
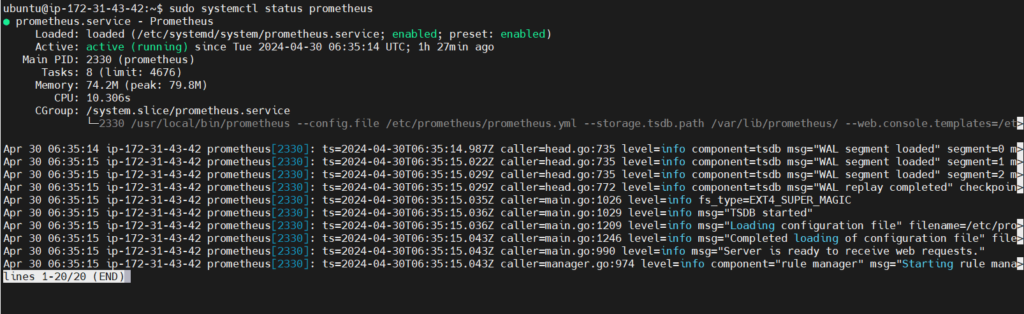
sudo systemctl status kafka
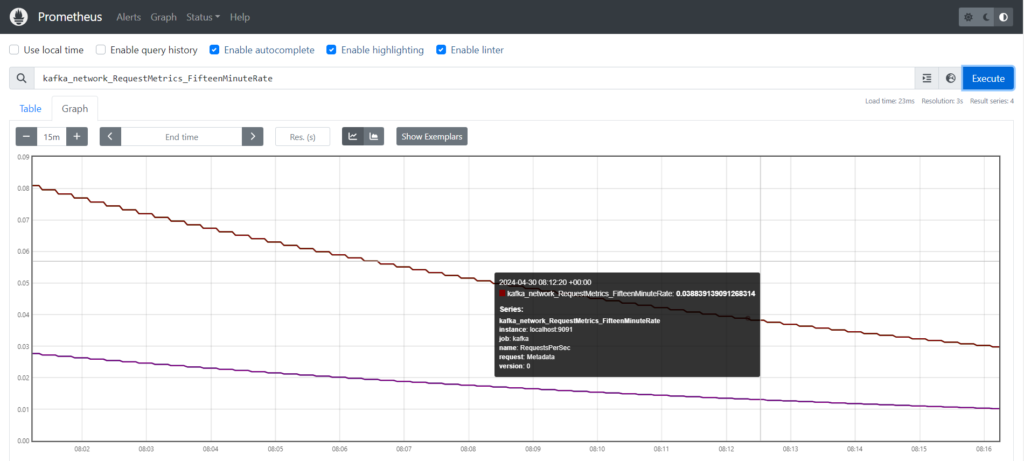
Step#6:Integrate/Monitor Kafka Metrics in Prometheus
Copy your Instance Id and Paste in the url with the default port of Prometheus
http://your_ip_address:9090/
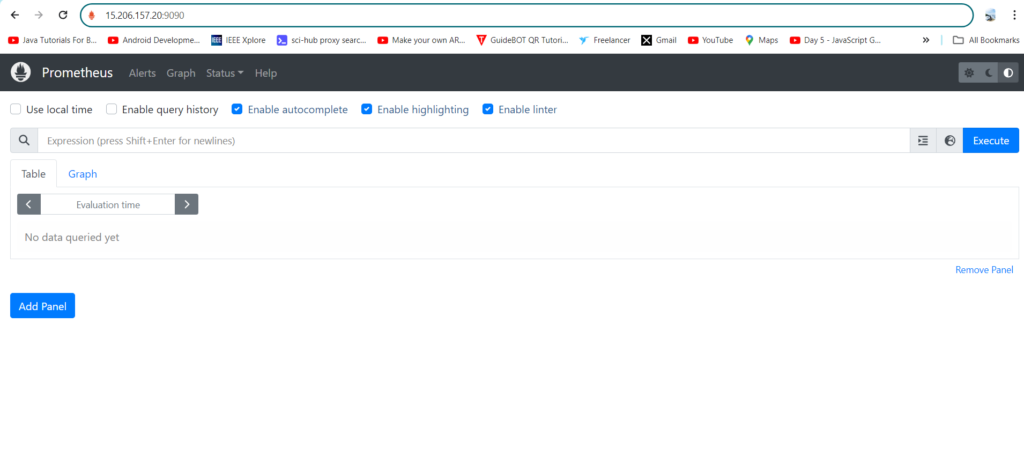
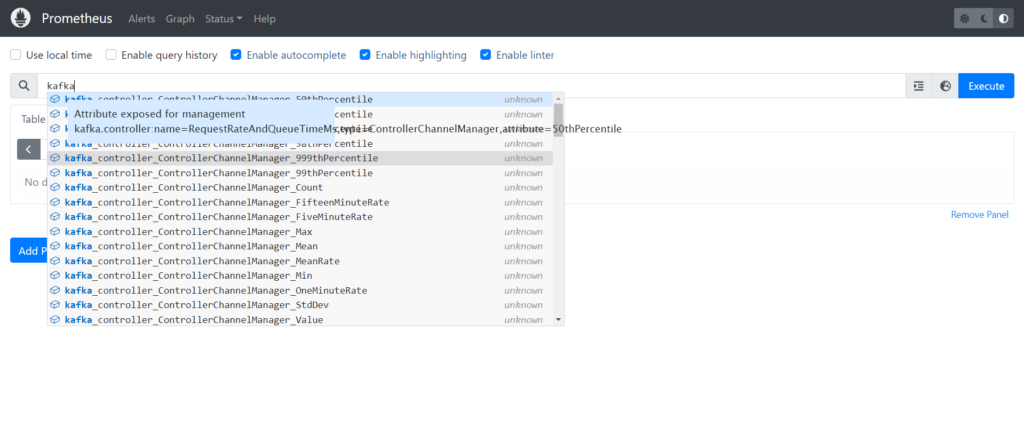
By now, you can see kafka metrics on the Prometheus UI, sample below.
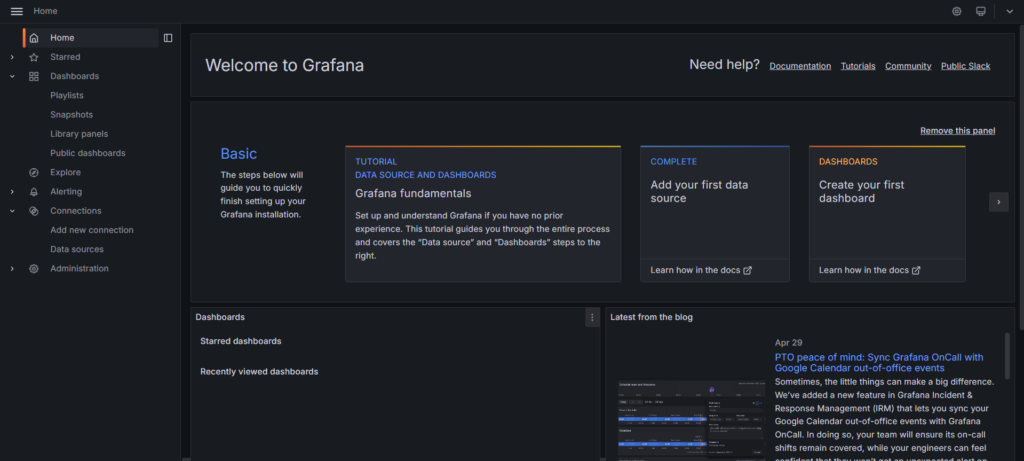
Step#7:Integrate/Monitor Kafka Metrics in Grafana
Copy your Instance Id and Paste in the url with the default port of Prometheus
http://your_ip_address:3000/
If successful, you should see it at up on its default port 3000. Default username and password both are “admin”. It will prompt to change password on first time login.
Next add your Prometheus as a data source. Click on Settings -> Data sources -> Add data source. Input your local Prometheus url.

Click on Save and Test

Click on Explore View then Select metric as “kafka_controller_kafkacontroller_activebrokercount” and Job as “Kafka” and Run the Query
The metric kafka_controller_kafkacontroller_activebrokercount represents the number of active brokers managed by the Kafka controller. It indicates the current count of brokers that are actively participating in the Kafka cluster, providing insights into cluster health and availability.
Output-

Conclusion
In conclusion, setting up monitoring for Apache Kafka using Prometheus and Grafana on Ubuntu provides valuable insights into Kafka’s performance, allowing proactive management and optimization of Kafka clusters. With metrics visualization and alerting capabilities, administrators can ensure the reliability and efficiency of Kafka-based data pipelines, enhancing overall system reliability and operational effectiveness.
Reference:-
For reference visit the official website .
Any queries pls contact us @Fosstechnix.com.
Related Articles: